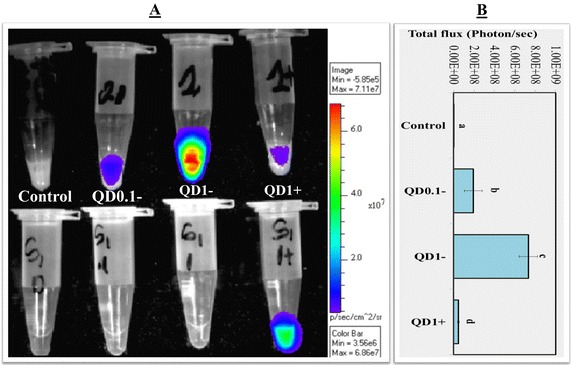
Figure 2.

Bioluminescence imaging (BLI) of spermatozoa. A BLI of spermatozoa labeled with 0 nM (Control), 0.1 nM (QD0.1−), and 1 nM (QD1−) QD-BRET. Spermatozoa labeled with QD conjugated with anti-plasminogen antibody (QD1+) are also shown. Corresponding supernatants containing excess of QD− or QD+ are also imaged (bottom tubes, hand-marked S1). All samples were mixed with coelenterazine, the luciferase substrate before BLI. The quantification of total signals (photons/s) is summarized in B. Data are mean ± SEM of four independent replicates, and different letters indicate significant difference between columns (P < 0.05; ANOVA 1).
