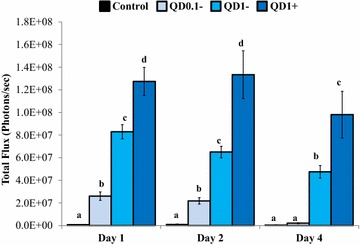
Figure 7.

Quantification of ex vivo bioluminescence emission of ovarian follicles. Totals of 52, 28, and 32 follicles were respectively analyzed on Day 1, Day 2, and Day 4, which corresponded to 13, 7, and 8 follicles in each labeling group (Control, QD1−, and QD1+). The day of QD-BRET microinjection was considered as Day 0. Data are mean (± SEM) of three independent replicates and statistical comparisons were done within days (Day 1, Day2, or Day 4). Columns with different letters indicate significant differences (P < 0.05; ANOVA 1).
