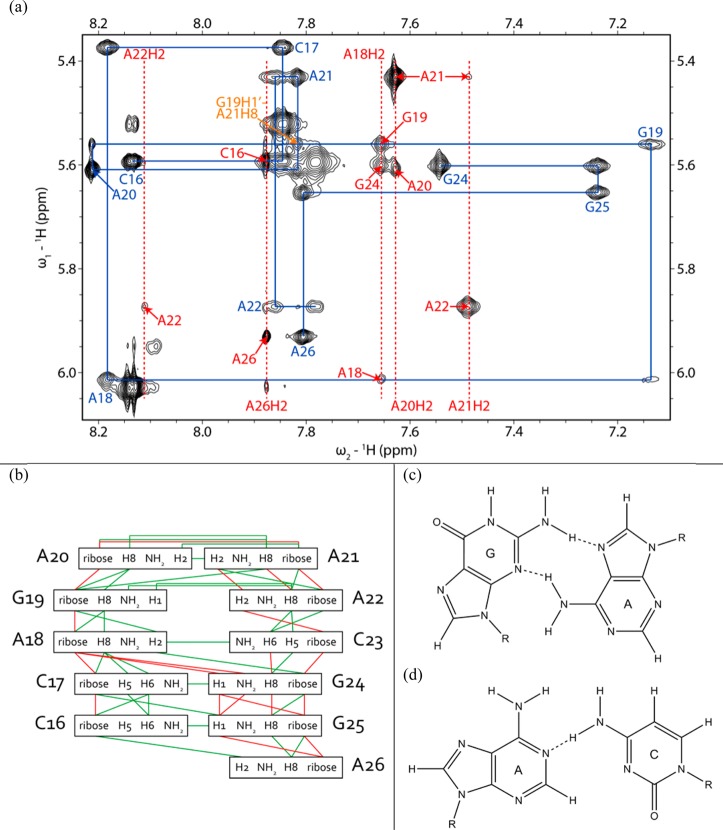
Figure 6.
(a) H1′–H6/H8 region of a 2D proton NOESY spectrum of the 11 nt hairpin showing a sequential proton walk with blue lines. H1′–H6/H8 walk NOEs are labeled in blue. Adenine H2 signals are labeled with red dashed lines. H1′–adenine H2 NOEs are labeled in red with only the label of the residue for H1′. The G19H1′ (5.56 ppm)–A21H8 (7.89 ppm) NOE is labeled in orange and is consistent with the formation of a GNRA-like U-turn. The spectrum was recorded at −2 °C in D2O and 5 mM Mg2+ with a mixing time of 400 ms. Cross-peaks from C23H1′ to A22H2 and C23H6 were not observed in this spectrum, but in a spectrum acquired at 20 °C with a mixing time of 400 ms. (b) Secondary structure of the 11 nt hairpin with assigned interresidue NOEs. Green lines denote NOEs identified in the 11-mer and the 39 nt hairpin and red lines NOEs identified only in the 11-mer. (c) Geometry of the G19-A22 sheared GA pair observed in the AMBER-refined structures. (d) Geometry of the A18-C23 pair observed in most of the AMBER-refined structures.

