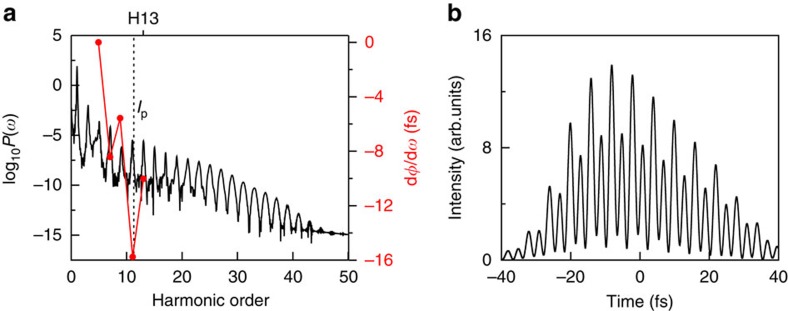
Figure 1. HHG power spectra of Cs and time-domain synthesis of the harmonics.
(a) The HHG power spectrum of Cs driven by an intense 3,600-nm (mid-infrared) laser pulse with the peak intensity I=1.4 × 10¹²W cm−2. The black vertical dashed line indicates the corresponding ionization threshold marked by Ip. The dφ/dω denotes the emission time associated a group of harmonics with the central frequency ω, where φ(ω) is the spectral phase of the HHG. (b) A time-domain superposition of the harmonics 7–13. Note that the maximum burst has a duration of about 4.3 fs.

