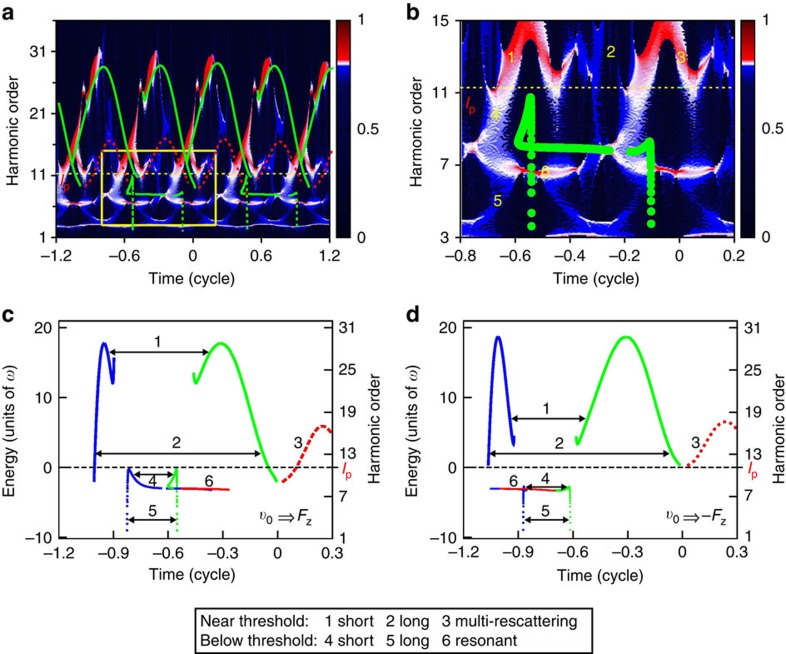
Figure 2. SST time-frequency spectra and semiclassical trajectories.
(a) SST time-frequency analysis of the HHG spectra of Cs. For comparison, the green curves (both solid lines and dots) and the red dashed lines indicate the semiclassical trajectories of the first return and second return, respectively. (b) An enlarged view of the SST time-frequency profiles in the near- and below-threshold regions (marked by the yellow window in a). (c) Semiclassical return energy as a function of ionization time (blue lines) and return time (green lines and red dashed lines). Here the initial condition is that the electrons with an initial velocity v0 are released along the electronic-field force Fz. For clarity, we only show the semiclassical simulation for the electrons released during one optical cycle preceding the pulse peak. (d) Same as c, for the electrons with an initial velocity v0 are released against the electronic-field force Fz. The laser parameters used are the same as those in Fig. 1a.

