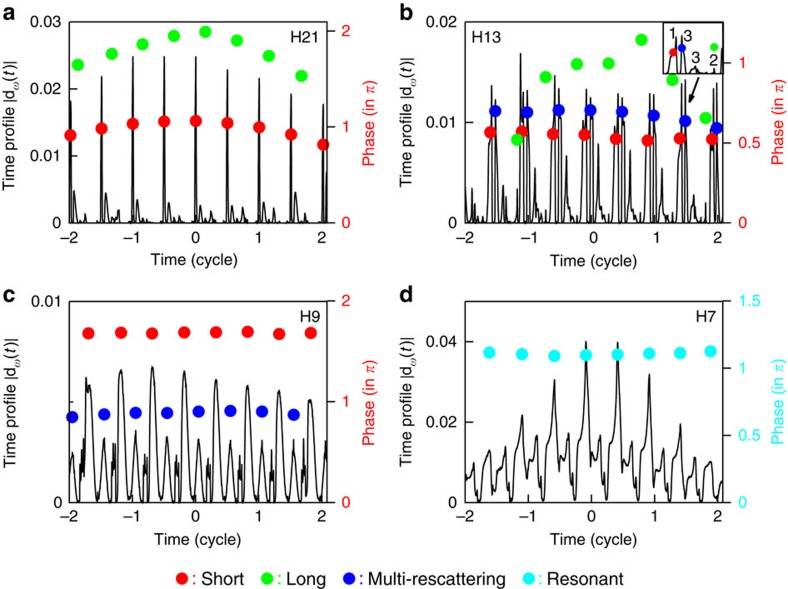
Figure 4. Time profiles and dynamical phase of the harmonic spectra of Cs.
(a) The time profiles of the 21st harmonic (H21, above threshold). The red dots and green dots are the corresponding dynamical phases for the peak intensity of the short trajectories and long trajectories calculated by the SST, respectively. (b) Same as a, for the time profiles of the 13th harmonic (H13, near threshold). The blue dots are the corresponding dynamical phases of the multi-rescattering trajectories (second return). The inset shows an enlarged view of the time profiles indicated by the black arrow. Note that the numbers have the same meanings as shown in Fig. 2, namely, short trajectories 1, long trajectories 2, and multi-rescattering trajectories 3 (second return and third return). (c) Same as a, for the time profiles of the 9th harmonic (H9, below threshold, nonresonant). (d) Same as a, for the time profiles of the 7th harmonic (H7, below-threshold resonant). The light blue dots are the corresponding dynamical phases of the resonant trajectories. The laser parameters are the same of those in Fig. 1a.

