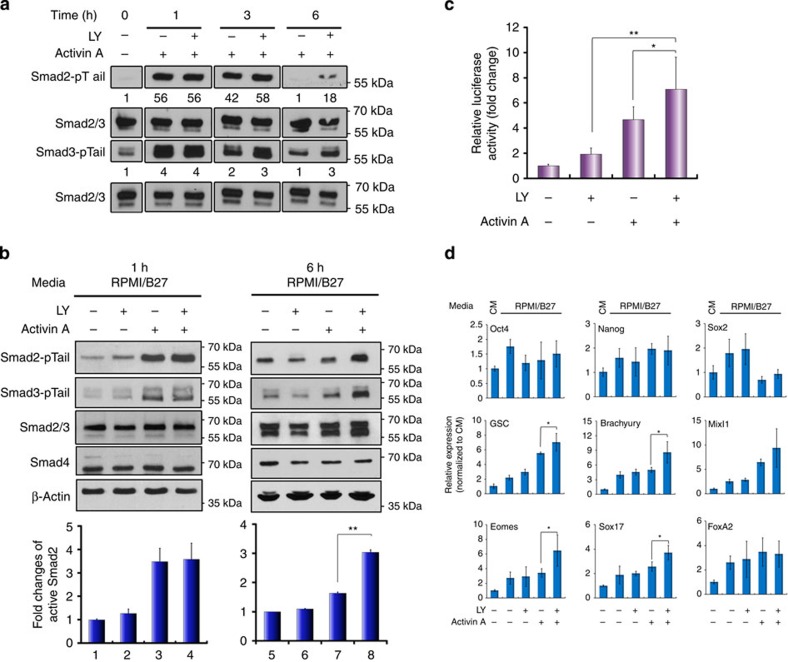
Figure 2. Suppression of PI3K signalling prolongs Activin-induced Smad2/3 activity.
(a,b) hESCs were treated with Activin A or/and LY for the indicted time points before being subjected to immunoblotting analysis. Numbers in a represent the quantification of activated Smad2 and Smad3. Upper panels in b are representative immunoblot and lower panels are histograms of densitometric measurements from three independent biological samples. (c) Luciferase assay in hESCs co-transfected with pGL3-CAGA12-luc and renilla constructs and treated for 6 h. Data show mean±s.d. of three independent transfection experiments. (d) Messenger RNA expression of indicated markers by qRT–PCR. Bar graphs indicate fold induction. Data represent mean±s.d. of six measurements from two independent experiments. **P<0.001 and *P≤0.05 by the Student's t-test. LY, LY294002.

