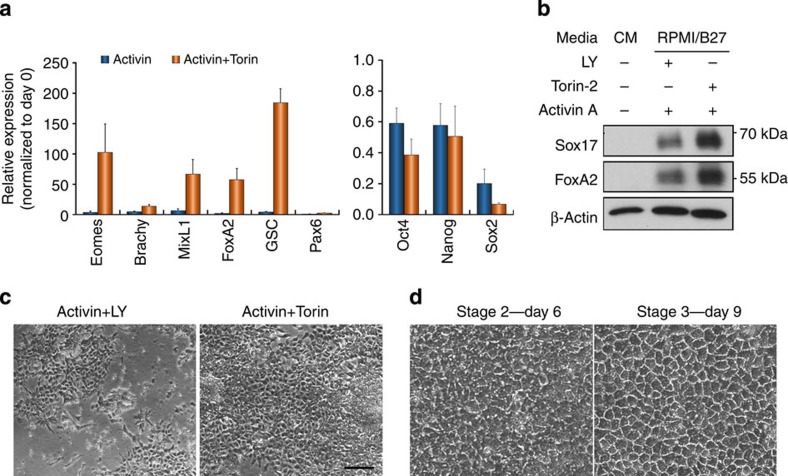
Figure 7. Inhibition of mTOR enhances DE differentiation of hESCs.
(a) qRT–PCR showing gene expression in hESCs treated with Activin A±Torin for 2 days. Data represent mean±s.d. of six measurements from two independent experiments. (b) Immunoblot showing protein expression in hESCs treated as in a. (c) Phase-contrast images of hESCs treated for 3 days with Activin A together with either LY or Torin. Scale bar, 100 μm. (d) Phase-contrast images of the cells from c that were further differentiated by a hepatic differentiation protocol as shown in Fig. 1. Days of differentiation are indicated. Scale bar, 50 μm.

