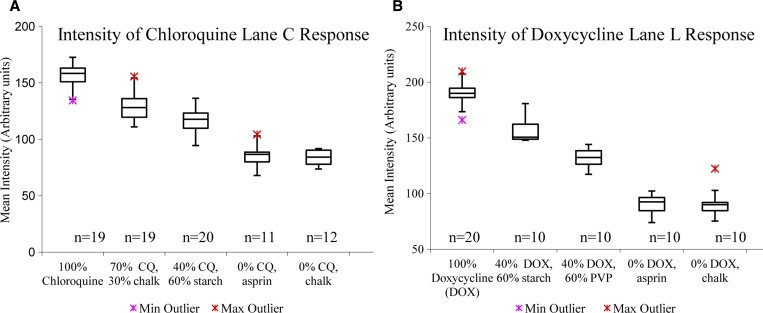
Figure 3.
(A) Blue color of chloroquine (CQ) in Lane C region of interest measured as mean intensity of inverted image in red channel. (B) Brown color of doxycycline (DOX) in Lane L region of interest measured as mean intensity of inverted image in gray scale. Box plots depict the median (horizontal line), second and third quartile (box), and 1.5 × interquartile range (whiskers) for each sample group; sample sizes are provided below each box. Minimum and maximum outliers shown with crosses.

