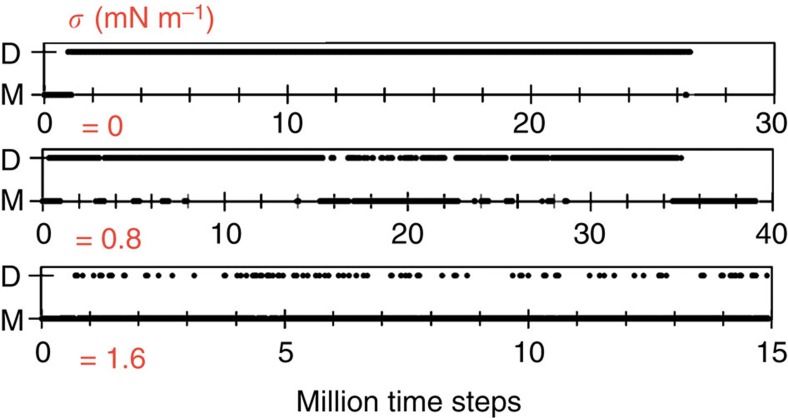
Figure 1. Dynamics of dimerization of N-BARs at 4% surface coverage.
The kymogram is generated by observing a protein and recording, at each time step, the dimer (D) or the monomer (M) state. Increasing tension significantly reduces the lifetime of dimers. Each plot is a representative of three individual measurements.

