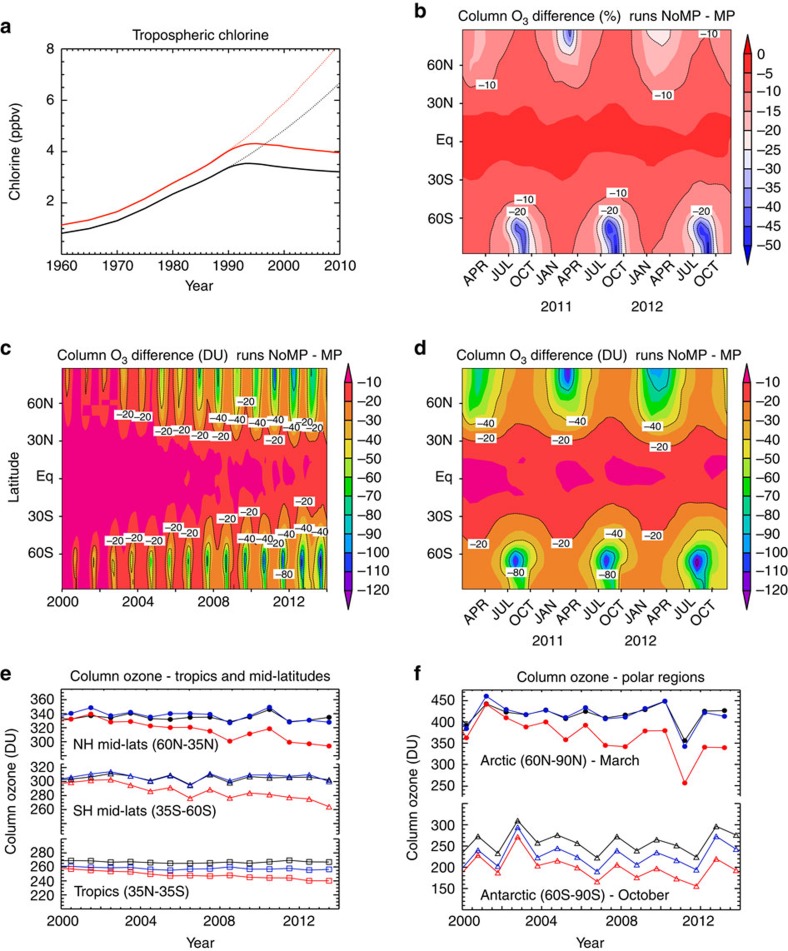
Figure 1. Calculated impact of Montreal Protocol on atmospheric halogens and column ozone.
(a) Time series of surface chlorine (black) and surface equivalent chlorine (chlorine+50 × bromine, red) from observations (solid lines) and assumed 3% growth (dotted lines). (b–d) The difference in zonal mean monthly mean column ozone (DU) between run MP and run NoMP for (b) 2010–2012 (%), (c) 2000–2013 (DU) and (d) 2010–2012 (DU). (d) The same results as c on an expanded time axis for clarity. (b) The same results as d but as a percentage change. (e, f) Comparisons of SBUV observed column ozone37 in different latitude regions (black) with model runs MP (blue) and NoMP (red).

