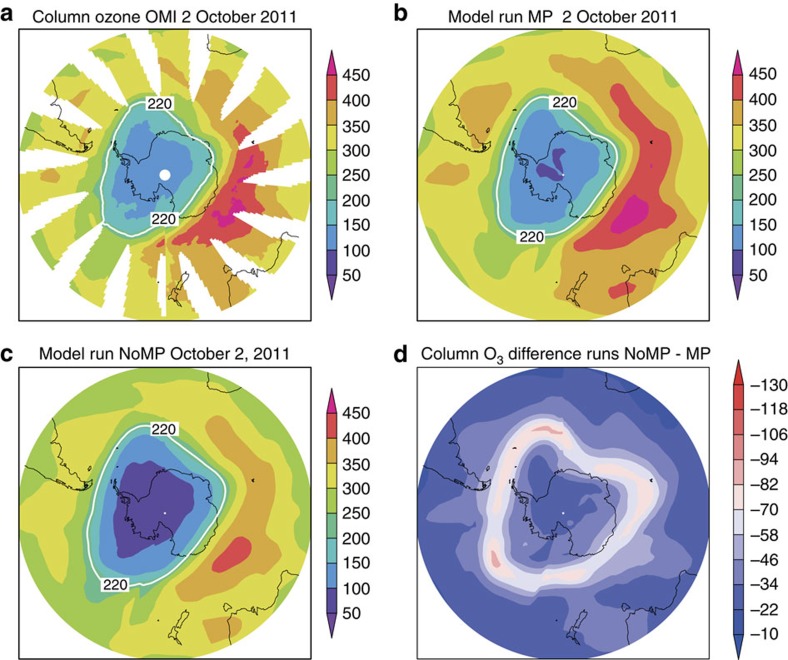
Figure 2. Column ozone in the Antarctic from satellite observations and model for October 2011.
Column ozone (DU) on 2 October 2011 (a) observed by OMI, (b) from model run MP and (c) from model run NoMP (with the 220 DU contour indicated in white). (d) Difference in column ozone between runs NoMP and MP.

