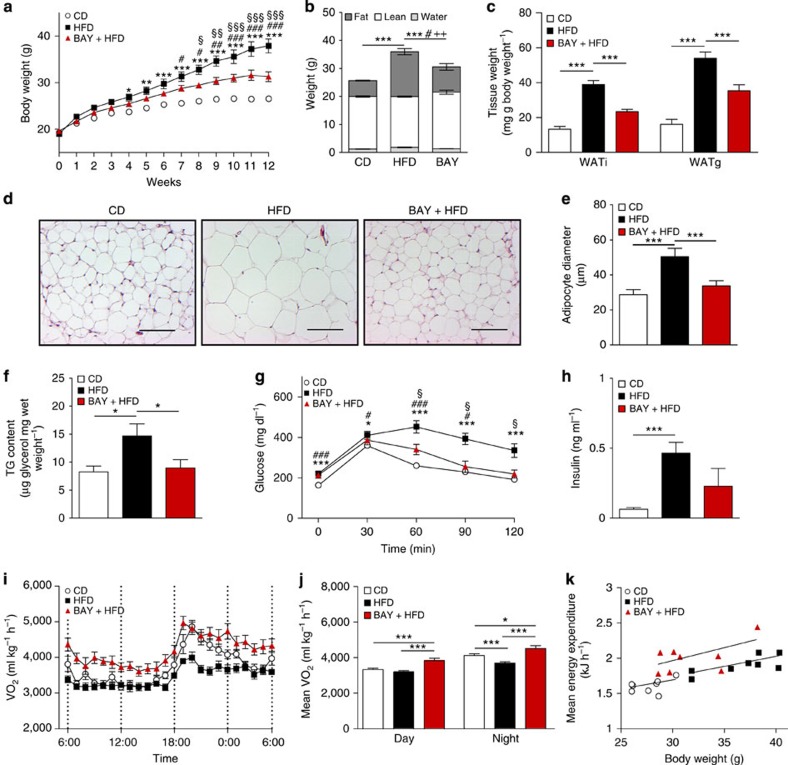
Figure 2. Stimulation of sGC reduces diet-induced obesity.
(a,b) Effects of sGC stimulation on body weights (a) and body composition (b) of mice maintained on chow CD or HFD with or without BAY, n=8 mice per group. For (a) *HFD versus CD; #BAY versus CD; §BAY versus HFD and for (b) *fat; #lean;+free water. (c) Weights of WATi and gonadal WAT (WATg) deposits after treatment with or without BAY. (d,e) Representative images of WATi sections stained with haematoxylin and eosin, scale bar, 100 μm (d) and diameter of adipocytes in WATi (e). (f) TG content of the liver from mice fed CD or HFD with or without BAY. (g) Glucose tolerance test performed in week 12 of the study, *HFD versus CD; #BAY versus CD; §BAY versus HFD. (h) Insulin plasma levels at the end of the study. (i,j) Oxygen consumption (VO2) (i) and the mean oxygen consumption during day and night (j) of mice fed CD, HFD or HFD+BAY. (k) The mean energy expenditure in relation to body weight. All data were assessed using Student's t-test, except in a, where two-way analysis of variance (ANOVA) was applied and are presented as means±s.e.m. *,§,#P<0.05; **, §§,##P<0.01; ***, §§§,###P<0.005.

