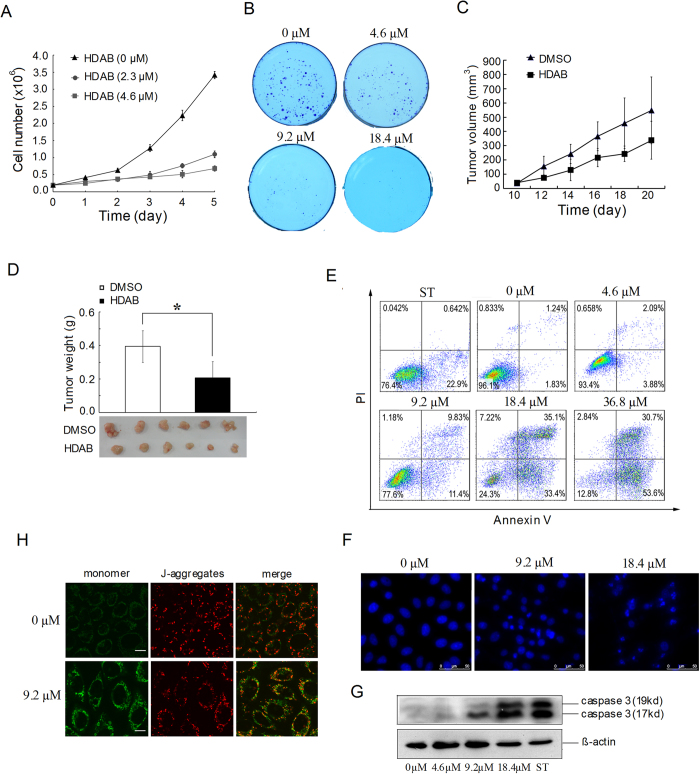
Figure 2. Effects of HDAB on the growth and apoptosis of cervical cancer cells.
(A) HeLa cells were treated with the indicated concentrations of HDAB and cell number was calculated. The data are presented as the mean ±SD (B) Colony formation ability of HeLa cells treated with the indicated concentrations of HDAB in soft agar and imaged on day 10. (C) The growth curves of subcutaneous tumours in mice treated with HDAB or DMSO. The data are presented as the mean ±SD (n = 6 in each group). (D) Weights of the tumours from mice sacrificed 20 days after treatment (* p < 0.05). (E) Apoptosis was analysed by annexin V/PI staining after 24 h of treatment with staurosporine (0.5 μM) or HDAB at the indicated concentrations; representative histograms are shown. (F) Nuclear morphology was analysed by fluorescence microscopy after DAPI staining of cells treated for 48 h with HDAB; representative images are shown (Scale bar, 50 μm). (G) Activated caspase-3 was detected by Western blotting after 24 h of treatment with staurosporine (0.5 μM) or HDAB at the indicated concentrations. (H) Mitochondrial membrane potential was detected by JC-1 staining after 24 h of treatment with HDAB; representative images are shown (Scale bar, 10 μm).

