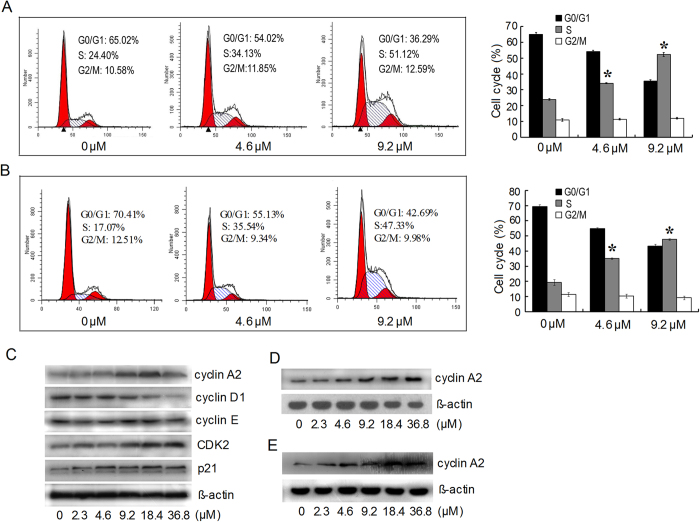
Figure 3. Effects of HDAB on the cell cycle in HeLa cells.
(A) and (B) The cell cycle distributions of HeLa and CaSki were analysed by flow cytometry after 24 h of treatment with the indicated concentrations of HDAB, respectively; representative images are shown (left panel). Three independent experiments were performed; the data are presented as the mean ±SD (column, *p < 0.05). (C) Cell cycle-related proteins were detected by Western blotting after 24 h of treatment with the indicated concentrations of HDAB. (D) and (E) The expression of cyclin A2 in HeLa and CaSki cells treated with HDAB (9.2 μM) was detected at the indicated time points, respectively.

