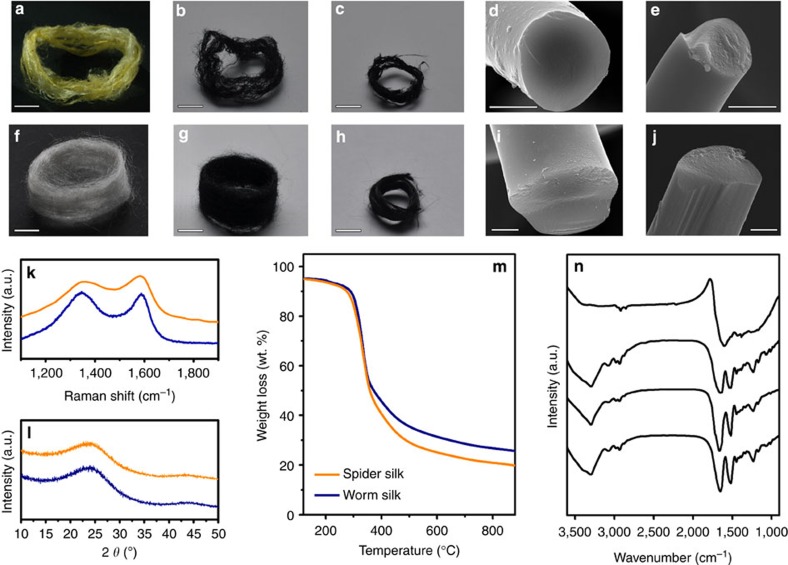
Figure 1. Pyrolysis behaviour of silk proteins.
Photographs of (a) dragline silk fibres obtained from N. clavata spider webs and after pyrolysis at (b) 800 °C and (c) 2,800 °C. Scanning electron microscopy (SEM) images of dragline silk fibres after pyrolysis at (d) 800 °C and (e) 2,800 °C. Scale bars, 5 mm for a–c and 2 μm for d,e. Optical images of (f) silk fibroin fibres produced by Bombyx mori silkworm and after pyrolysis at (g) 800 °C and (h) 2,800 °C. SEM images of silkworm silk fibres after pyrolysis at (i) 800 °C and (j) 2,800 °C. Scale bars, 5 mm for f–h and 2 μm for i,j. (k) Raman spectra and (l) XRD patterns of the pyrolysed spider silk (orange) and silkworm silk (navy blue). (m) Thermogravimetric analysis curves of spider silk (orange) and silkworm silk (navy blue). An inert nitrogen gas atmosphere was used, and the scan rate was 10 °C min−1. (n) FT-IR spectra of an untreated silk protein and of silk protein samples with HTTs in the range 250–350 °C.

