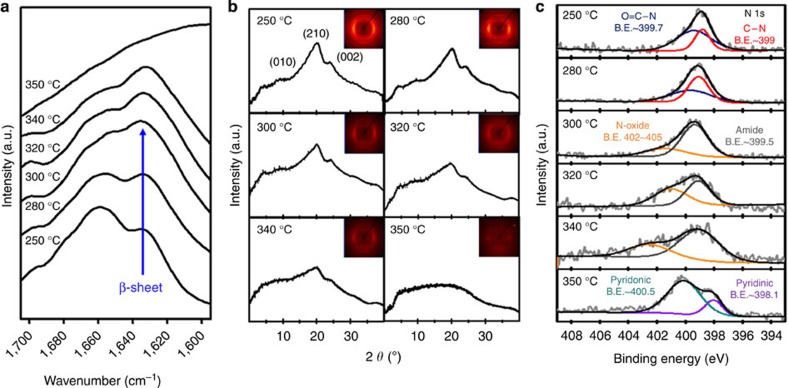
Figure 2. Structural and chemical transitions of proteins rich in β-sheets during pyrolysis.
(a) Amide I band region of the FT-IR spectra for silk proteins heated to temperatures in the range 250–350 °C for 60 min. Each spectrum was acquired in absorbance mode by accumulating 32 scans. (b) Wide-angle XRD patterns of silk proteins heated to various temperatures. Characteristic peaks of the β-sheet crystals were evident at 9.34°, 20.80° and 25.78° corresponding to (010), (210) and (002) planes, respectively. (c) XPS high-resolution N 1s spectra for silk proteins heated to temperatures in the range 250–350 °C. The peak at 399.7 eV corresponds to O=C–N; the peak at 399 eV corresponds to C–N; the peak at 402–405 eV corresponds to N-oxide; the peak at 400.5 eV corresponds to pyridonic N; and the peak at 398.1 eV corresponds to pyridinic N.

