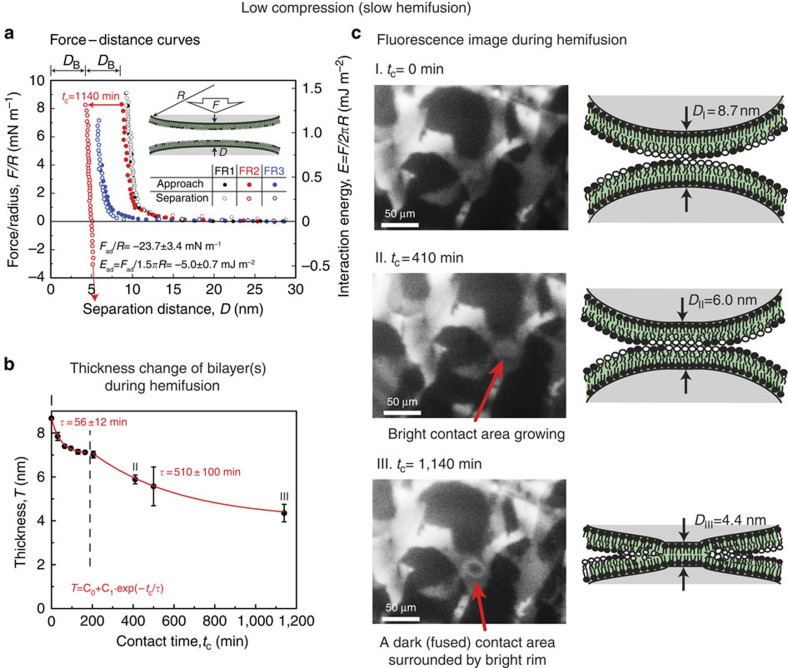
Figure 3. Low compression FL-SFA results.
(a) Force–distance (F–D) curve measured between two bilayers performed under low compression (F/R=8 mN m−1). The error value is the s.d. from the repeats of at least four experiments performed with different bilayers and contacts. (b) The bilayer thickness change, during slow hemifusion of two bilayers during a contact time of 1,140 min and (c) lipid domain reorganization during hemifusion.

