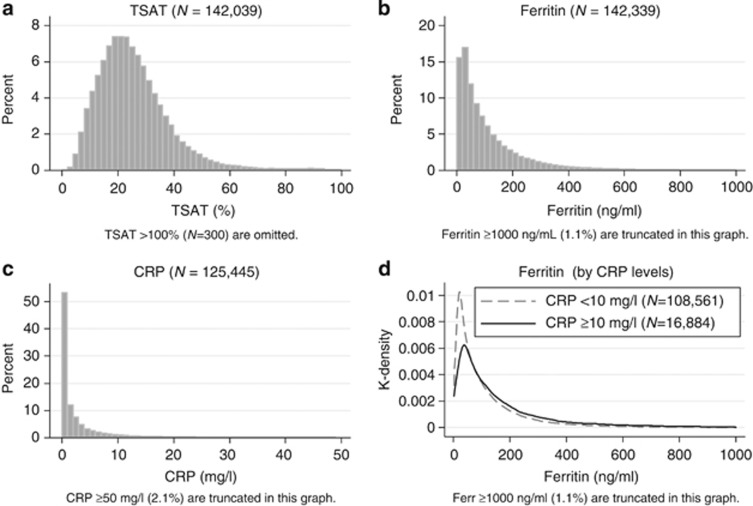
Figure 2.
Distributions of iron markers. Distributions of TSAT, ferritin, and CRP (a–c), and stratified distributions of ferritin by CRP levels (d).The distributions of TSAT, ferritin, and CRP were right-skewed. In d, the subjects were stratified by CRP level at 10 mg/l, which denoted the 87th percentile of CRP. The median and IQR of CRP were 62 (IQR: 29–149) and 102 (46–216) among the patients with CRP <10 mg/l and CRP ⩾10 mg/l, respectively. CRP, C-reactive protein; IQR, interquartile range; TSAT, transferrin saturation.

