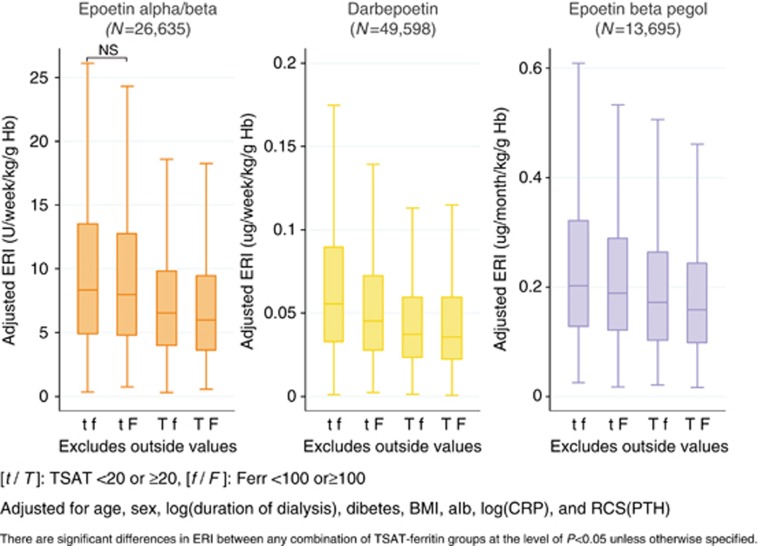
Figure 6.
Adjusted ERI according to the subgroups of TSAT and ferritin. After being stratified by ESAs, the patients were further divided into four subgroups according to TSAT and ferritin levels. The groups tf, tF, Tf, and TF denote the patients with TSAT <20 and ferritin <100, TSAT <20 and ferritin ⩾100, TSAT ⩾20 and ferritin <100, and TSAT ⩾20 and ferrritin ⩾100, respectively. The ERI levels were adjusted for age, gender, duration of dialysis, diabetes, BMI, Alb, CRP, and PTH within each type of ESA. Alb, albumin; BMI, body mass index; CRP, C-reactive protein; ERI, erythropoiesis resistance index; ESA, erythropoiesis-stimulating agent; Hb, hemoglobin; NS, not significant; PTH, parathyroid hormone; RCS, restricted cubic spline; TSAT, transferrin saturation.

