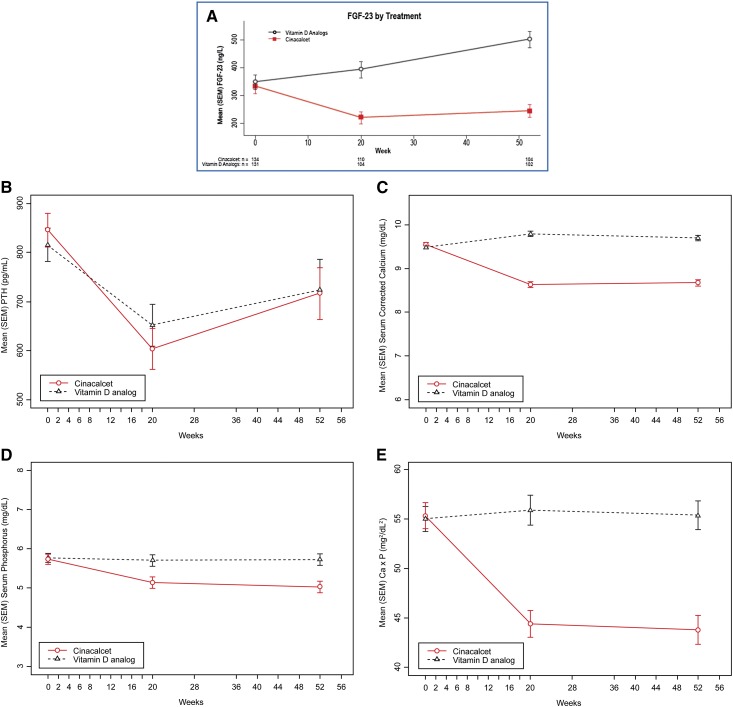
Figure 1.
Change in concentrations of FGF-23, PTH, Ca, P, and Ca x P by treatment arm over time. (A) Mean (SEM) fibroblast growth factor-23 (FGF-23; nanograms per liter) concentrations by treatment arm over time. (B) Mean (SEM) parathyroid hormone (PTH; picograms per milliliter) concentrations by treatment arm over time. (Cinacalcet: n=155, 129, and 111 at weeks 0, 20, and 52, respectively; vitamin D analog: n=157, 127, and 111 at weeks 0, 20, and 52, respectively.) (C) Mean (SEM) serum calcium (Ca; milligrams per deciliter) by treatment arm over time. (Cinacalcet: n=155, 130, and 111 at weeks 0, 20, and 52, respectively; vitamin D analog: n=157, 124, and 112 at weeks 0, 20, and 52, respectively.) (D) Mean (SEM) serum phosphorus (milligrams per deciliter) by treatment arm over time. (Cinacalcet: n=155, 141, and 109 at weeks 0, 20, and 52, respectively; vitamin D analog: n=157, 135, and 110 at weeks 0, 20, and 52, respectively.) (E) Mean (SEM) serum calcium-phosphorus product (Ca×P; milligrams2 per deciliter2) by treatment arm over time. (Cinacalcet: n=146, 129, and 108 at weeks 0, 20, and 52, respectively; vitamin D analog: n=150, 124, and 110 at weeks 0, 20, and 52, respectively.)

