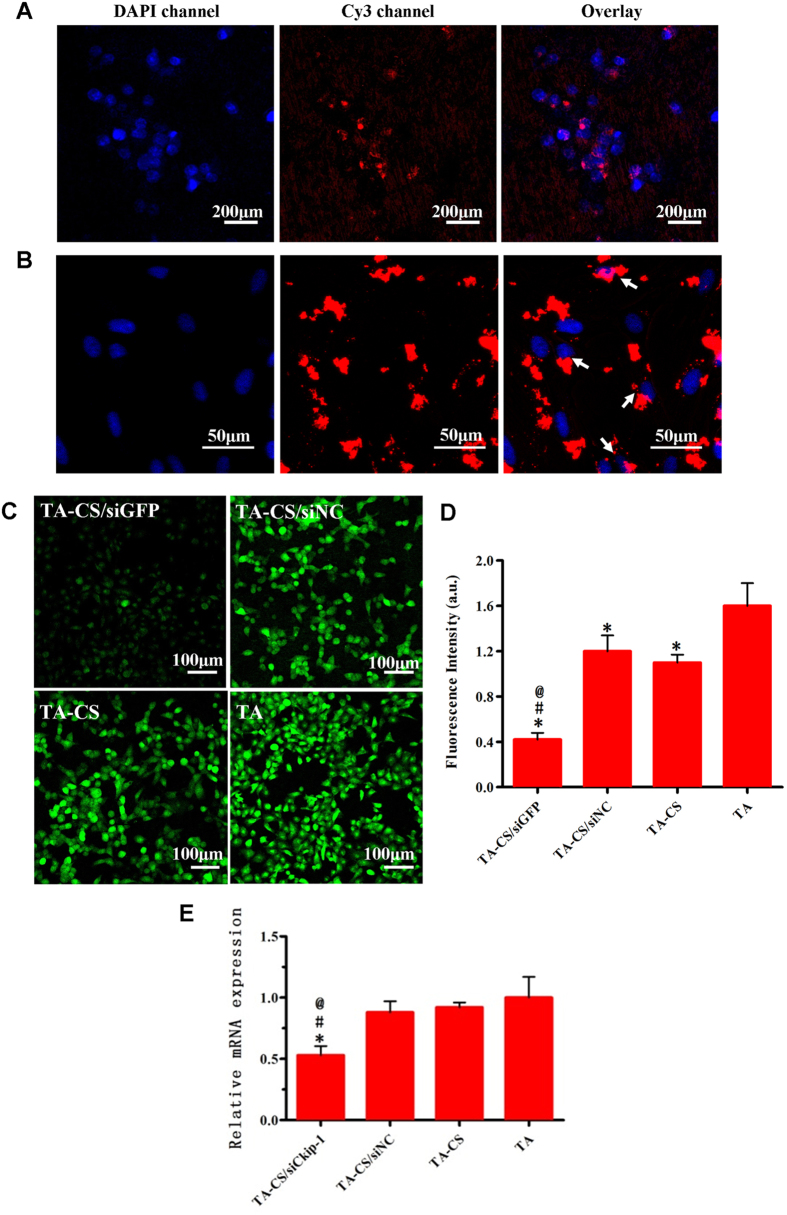
Figure 5.
(A) Cellular internalization of siGFP (red) from the Ti surfaces. The cell nucleus was stained by Hoechst Dye (blue). (B) Cellular internalization of siCkip-1 (red) from the Ti surfaces. The cell nucleus was stained by Hoechst Dye (blue). (C) GFP expression by the H1299 cells after 3-day culture on the Ti samples. (D) The average GFP fluorescent intensity of cells in Fig. 5, C by Image J. *p < 0.05 vs TA, #p < 0.05 vs TA-CS, @p < 0.05 vs TA-CS/siNC. (E) Relative Ckip-1 mRNA expression levels measured by real-time PCR 48 hours after culture on the Ti samples. *p < 0.05 vs TA, #p < 0.05 vs TA-CS, @p < 0.05 vs TA-CS/siNC.

