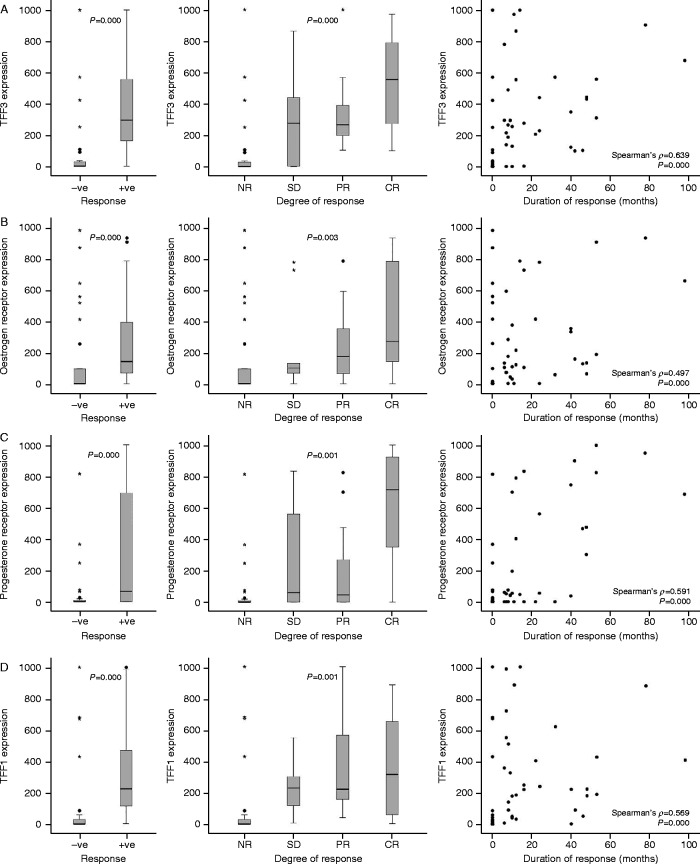
Figure 6.
The association of TFF3, TFF1, progesterone receptor and oestrogen receptor expression with response to hormonal therapy. TFF3 expression (A) was compared in malignant cells in tumours from patients without (−ve) and with (+ve) a response to endocrine therapy as well as from patients whose disease progressed (NR), stabilized (SD) or demonstrated a partial (PR) or complete response (CR) to endocrine therapy. Similar analyses are shown for TFF1 (B), progesterone receptor (C) and oestrogen receptor (D). The horizontal bars represent the median values, the boxes indicate the range of the second and third quartiles of the data and the whiskers represent the range of all the data. The circles represent outliers of more than 1.5 times, and the stars represent extreme values of more than 3.0 times farther from the third quartile than the difference between the third quartile and the median. The associations between each biomarker and the duration of response are shown. For each paired association, the Spearman's ρ and P values are indicated on the panels.

 This work is licensed under a