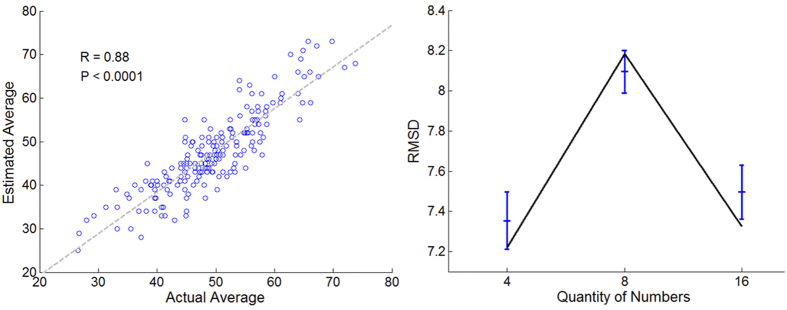
Figure 3.

Left-Panel: Performance of a single-subject in Exp. 2. The scatter plot depicts the participant’s evaluations (y-axis) for each of the presented number-sequence averages (x-axis). Dashed line is the regression line (R = 0.88; mean R for the 36 participants = 0.66). Right-Panel: observed accuracy (RMSD) for the different set-size conditions (4, 8 and 16 numbers) in Exp. 1-2 (blue bars). Accuracy in estimating the numbers’ average deteriorates when set size increases from 4 to 8, yet improves when set size increases from 8 to 16, suggesting a non-monotonic relation between set-size and accuracy. This pattern is captured by a dual-component model (black line). Estimations of the intuitive component parameters were obtained by fitting the intuitive component to Exp. 4 (see Suppl., for a description of the fitting procedure).
