5.

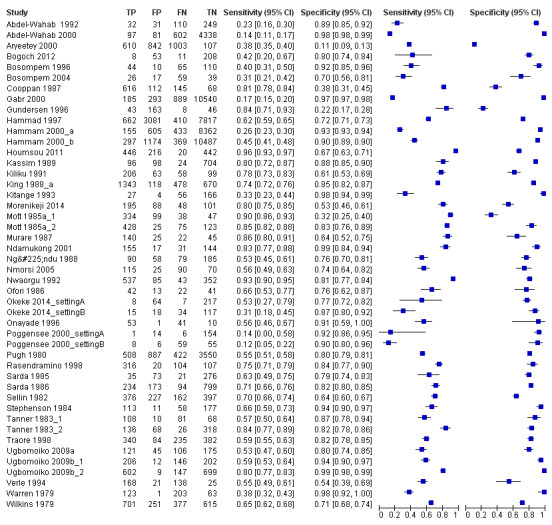
Forest plot of sensitivity and specificity of the urine reagent strip for proteinuria.
Squares represent the sensitivity and specificity of one study, the black line its confidence interval.

Forest plot of sensitivity and specificity of the urine reagent strip for proteinuria.
Squares represent the sensitivity and specificity of one study, the black line its confidence interval.