
8.
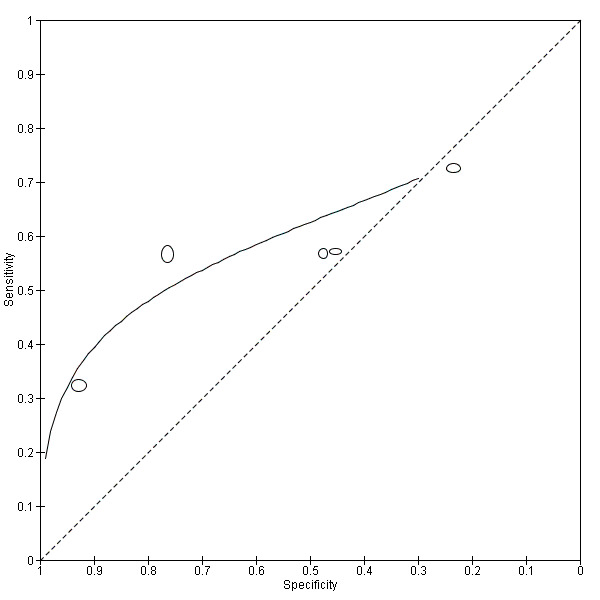
Summary ROC plot of sensitivity versus specificity of the urine reagent strip for leukocyturia.
The size of the points is proportional to the study sample size. The solid line shows the summary ROC curve.
Official websites use .gov
A
.gov website belongs to an official
government organization in the United States.
Secure .gov websites use HTTPS
A lock (
) or https:// means you've safely
connected to the .gov website. Share sensitive
information only on official, secure websites.
Summary ROC plot of sensitivity versus specificity of the urine reagent strip for leukocyturia.
The size of the points is proportional to the study sample size. The solid line shows the summary ROC curve.