
11.
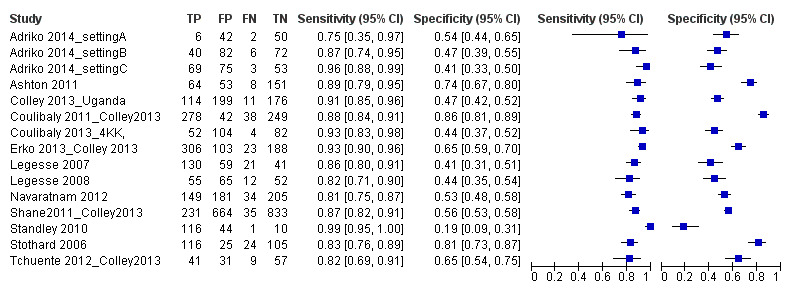
Forest plot of sensitivity and specificity of the urine CCA POC test for S. mansoni.
Squares represent the sensitivity and specificity of one study, the black line its confidence interval. Colley 2013 was a study that included data for 5 studies (done in different countries). Some of the studies had been published earlier (Coulibaly 2011, Erko 2013, Shane 2011, Tchuente 2012). In this case, we used data from Colley 2013, which provided the most recent and updated data.