
12.
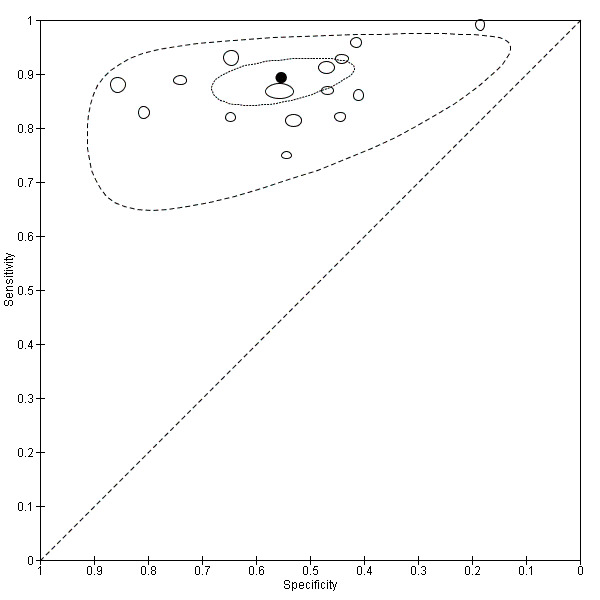
Summary ROC plot of sensitivity versus specificity of the urine CCA POC test for S. mansoni.
The size of the points is proportional to the study sample size. The thick black point shows the average value for sensitivity and specificity. The inner ellipse around the black spot represents the 95% confidence regions around the summary estimates. The outer ellipse represents the prediction region.