
13.
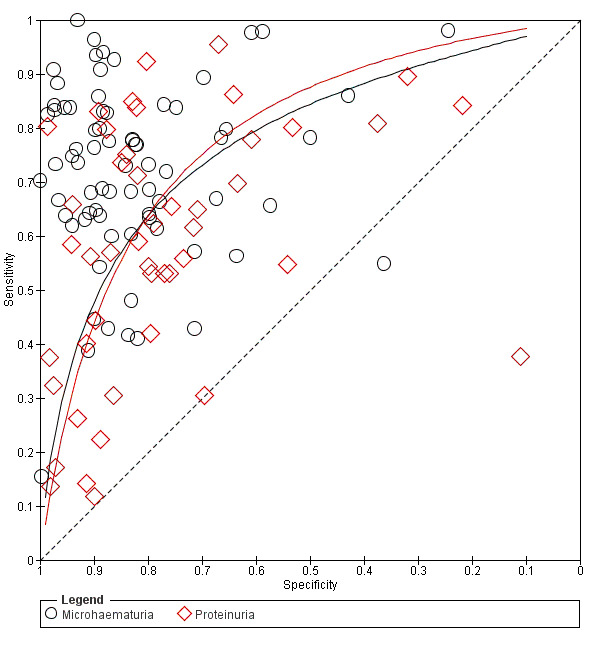
Summary ROC plot of sensitivity versus specificity showing the indirect comparison between microhaematuria and proteinuria (all studies). The solid lines show the summary ROC curves.
Official websites use .gov
A
.gov website belongs to an official
government organization in the United States.
Secure .gov websites use HTTPS
A lock (
) or https:// means you've safely
connected to the .gov website. Share sensitive
information only on official, secure websites.
Summary ROC plot of sensitivity versus specificity showing the indirect comparison between microhaematuria and proteinuria (all studies). The solid lines show the summary ROC curves.