
28.
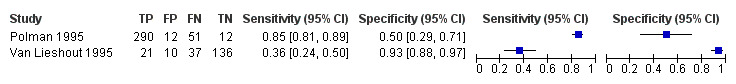
Forest plot of sensitivity and specificity of serum CCA ELISA for S. mansoni.
Squares represent the sensitivity and specificity of one study, the black line its confidence interval.
Official websites use .gov
A
.gov website belongs to an official
government organization in the United States.
Secure .gov websites use HTTPS
A lock (
) or https:// means you've safely
connected to the .gov website. Share sensitive
information only on official, secure websites.
Forest plot of sensitivity and specificity of serum CCA ELISA for S. mansoni.
Squares represent the sensitivity and specificity of one study, the black line its confidence interval.