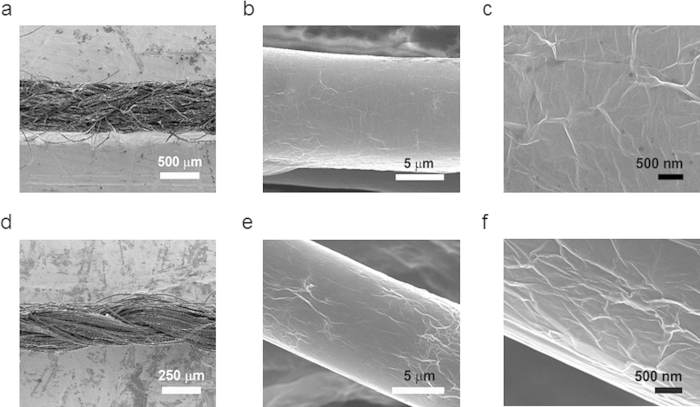
Figure 2. SEM images of RGOCY and RGOPY.
(a, d) SEM images of single RGOCY and RGOPY (scale bar = 500 and 250 \micro m). (b, e) SEM images of RGOCY and RGOPY micro fibrils (scale bar =5 \micro m). (c, f) HR-SEM images of micro fibril surface of RGOCY and RGOPY (scale bar = 500 nm). Numerous wrinkles were observed, indicating that RGO is well-wrapped around the yarn.

