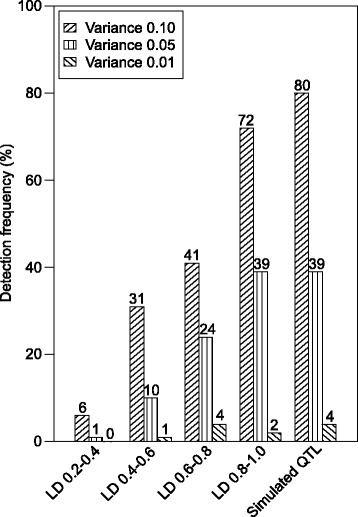
Fig. 3.

Simulations study of QTL detection power. Detection frequency of a simulated QTL explaining 1 % (0.01), 5 % (0.05), or 10 % (0.1) of the genotypic variance, assuming markers in linkage disequilibrium (LD) with the simulated QTL within r2 value classes 0.2–0.4, 0.4–0.6, 0.6–0.8, and 0.8–1.0
