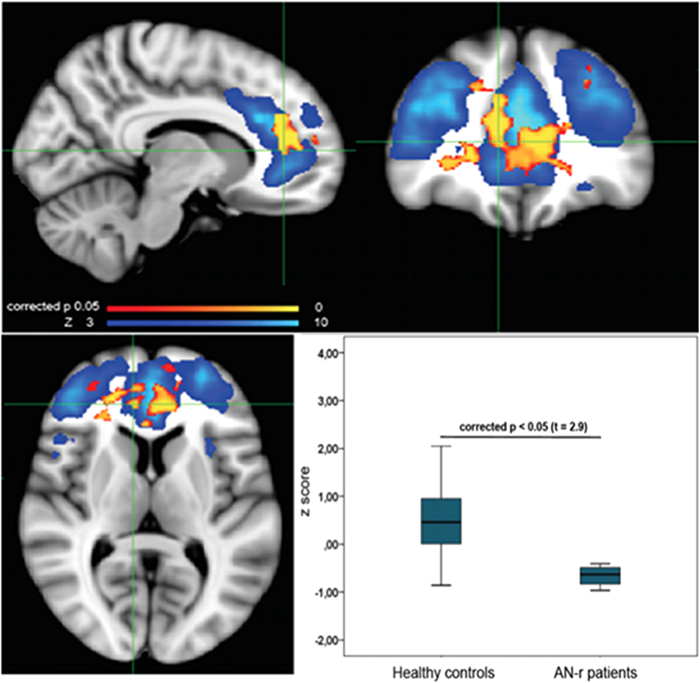
Figure 2.
Significant decrease of resting state functional connectivity of ECN in AN-r patients compared to healthy controls, p < 0.05 FWE corrected, overlaid onto the ECN network (blue color scale) in the MNI152 standard brain. The box plot shows the difference of z score of AN-r patients compared to healthy controls within the ECN.

