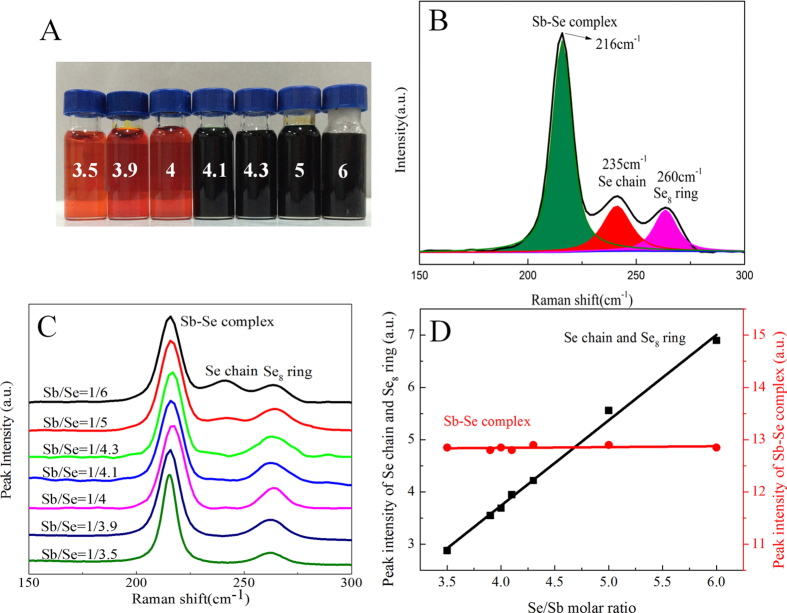
Figure 2. Raman spectroscopy characterization of Sb-Se precursor solutions with varied Se/Sb ratios.
A) a digital picture of the Sb-Se precursor solutions with varied Se/Sb ratios (value marked on the vial). B) Multi-peak fitting of the peaks obtained from the Sb-Se precursor solution with a Se/Sb molar ratio of 6. C) Raman spectra of Sb-Se precursor solutions with Se/Sb molar ratios ranging from 3.5 to 6. D) The integrated intensities of the peaks for the Sb-Se complex (•), and the peaks for the Se chain (235 cm−1) and Se8 ring (260 cm−1) (■) as a function of the Se/Sb molar ratio.

