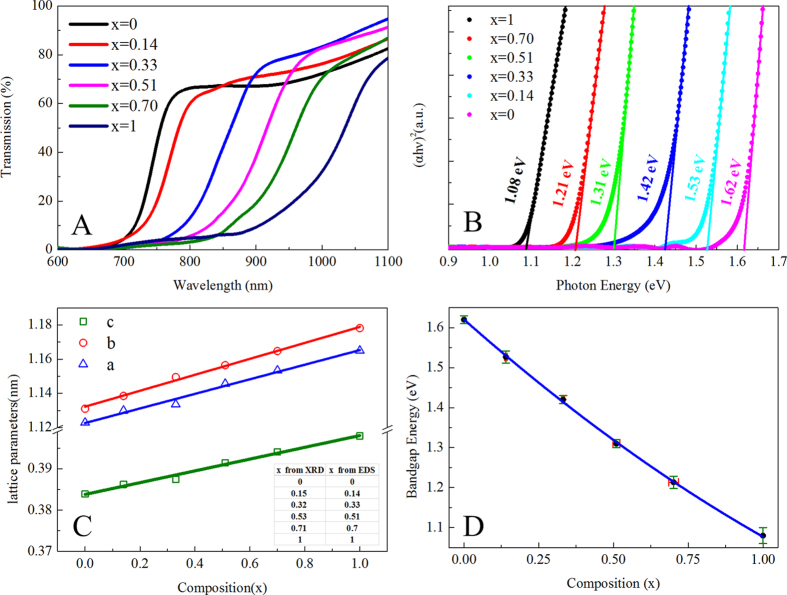
Figure 7. Optical properties of Sb2(S1−xSex)3 (0 ≤ x ≤ 1) alloy films with different Se concentration.
A) UV-vis-NIR transmission spectra of Sb2(S1−xSex)3 (0 ≤ x ≤ 1) alloy films; B) Pots of (αhv)2 vs the photon energy (hv) reveal the band-gaps of Sb2(S1−xSex)3 alloy films as 1.08, 1.21, 1.31, 1.42, 1.53, and 1.62 eV for x = 1, 0.70, 0.51, 0.33, 0.14, and 0, respectively; C) Lattice constants a (blue), b (red), and c (green), derived from XRD diffraction peaks, plotted as functions of Se concentration x in the Sb2(S1-xSex)3 alloy films. The inserted table shows the comparison of x derived from XRD and EDS. D) The band gap energy plotted verus the Se concentration x in the Sb2(S1-xSex)3 alloy films. The solid curve is a quadratic fit to the measured values of the band gap energy. The error bars labled by the red and green colors represent the uncertainties in the determination of the composition and the optical band gap of alloy films, respectively.

