
Figure 4. Growth curves on macroalgal extracts at 20 °C for representative E. coli isolates.
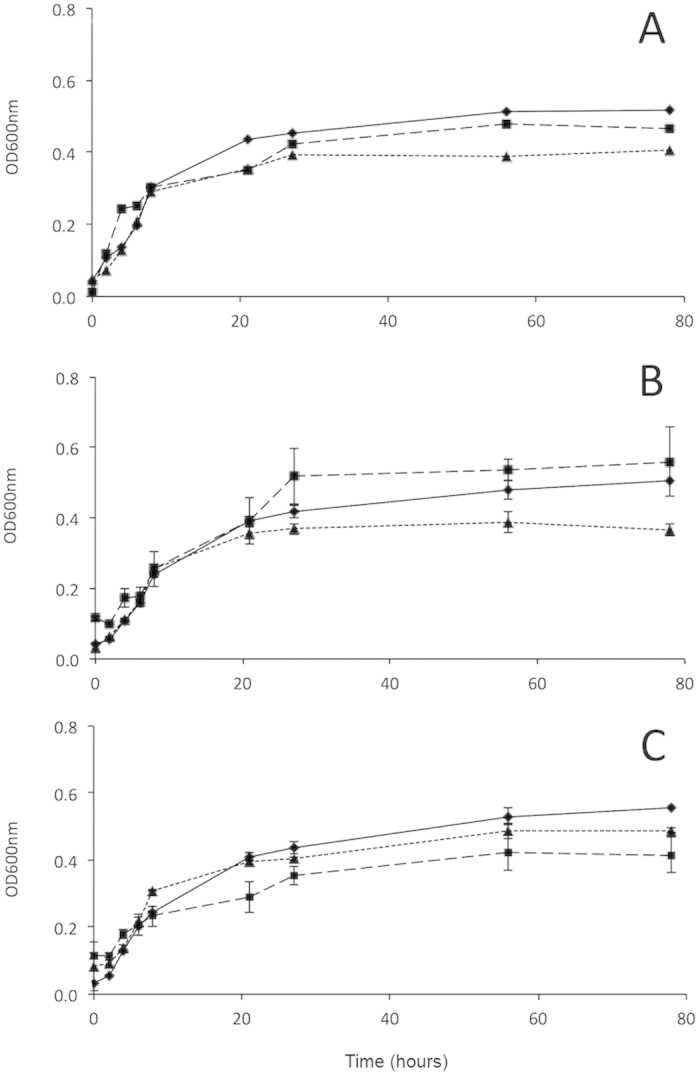
A = strain #223 isolated from Ulva; B = strain #349 isolated from Sargassum; C = strain #306 isolated from Undaria. Triangles refer to the growth on the Undaria medium, while rhombuses to the growth on Sargassum and squares on Ulva. The data are averages ± standard errors of the averages. OD600nm = optical density at 600 nm.