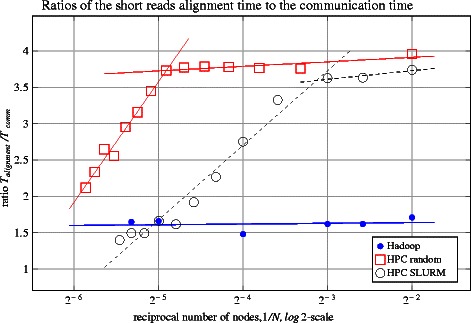
Figure 4.

The ratio of the F Hadoop/F HPC as a function of the reciprocal dataset size in Gb. The pipelines were run on the Hadoop I and II clusters, as well as a 16 core HPC node. The analytical curve f(x)=(a 1 x+b 1)/(a 2 x+b 2) was used to fit the data for the stretches of linear scaling of calculation time on the HPC platform. The outliers are marked with crossed symbols.
