Fig. 3.

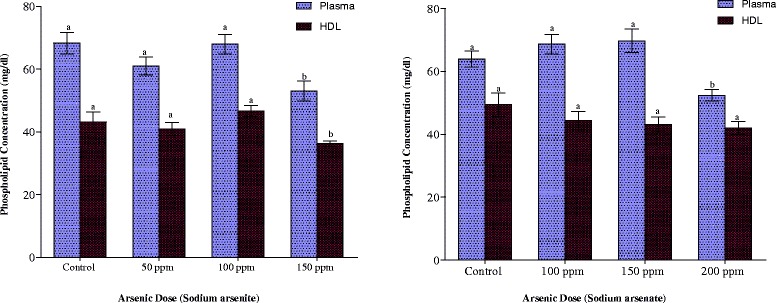
Effects of arsenite and arsenate on plasma and HDL phospholipid concentrations. Each bar represents the mean ± S.E.M. of 7 rats. Bars with different alphabets are significantly different at p < 0.05

Effects of arsenite and arsenate on plasma and HDL phospholipid concentrations. Each bar represents the mean ± S.E.M. of 7 rats. Bars with different alphabets are significantly different at p < 0.05