Figure 2.

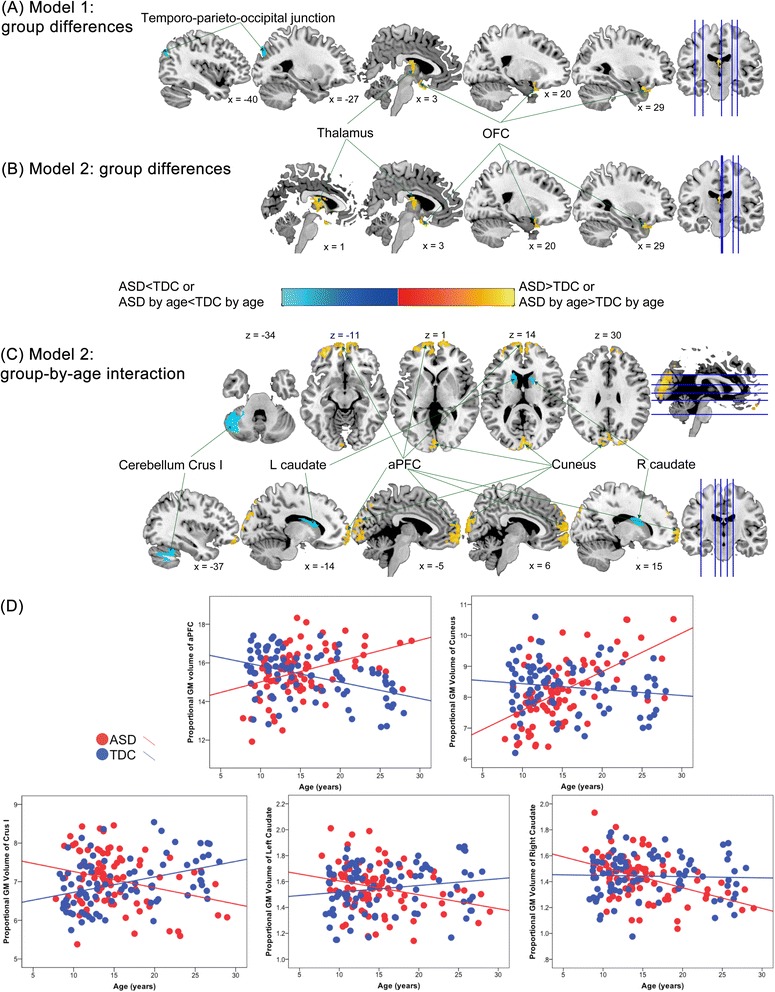
Group differences in relative regional gray matter (GM) volume between the autism spectrum disorder (ASD) and typically developing control (TDC) groups. (A) In model 1 (only controlling for age effects), individuals with ASD, relative to TDC, had larger relative GM volumes in the thalamus and orbitofrontal cortex (OFC) and smaller relative GM volumes in the temporo-parieto-occipital junction. (B) In model 2 (additionally considering diagnosis-by-age interaction effects), the main effect of diagnosis was identified in the thalamus and OFC (larger GM volumes in the ASD group, compared to TDC group), similar to those found in model 1. (C) The bilateral anterior prefrontal cortex (aPFC), bilateral cuneus, bilateral caudate, and left cerebellum Crus I showed significant diagnosis-by-age interaction in model 2. (D) Scatterplots descriptively illustrate the relationships between age and relative volumes of the regions showing significant diagnosis-by-age interaction.
