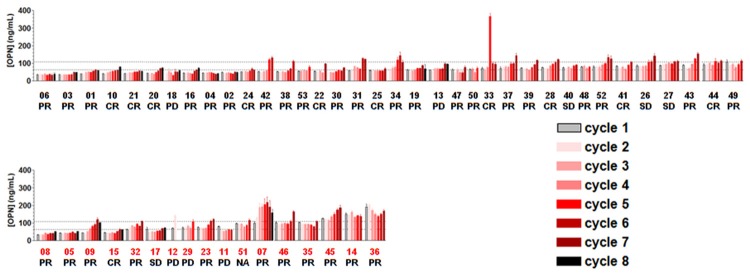
Figure 1.

Plasma OPN levels (ng/ml) during neoadjuvant therapy with final response to treatment and survival for all 53 LABC patients. At every treatment cycle plasma samples were obtained and OPN was measured in triplicate by ELISA. Average OPN levels are shown in ng/ml. Final patient response is denoted as complete response (CR), partial response (PR), stable disease (SD) or progressive disease (PD). Patient numbers (see Table 1) in black (upper panel) indicate patients who are alive and red (lower panel) numbers indicate patients who have died. Patients in each panel are grouped according to increasing baseline OPN, except patients for which no baseline OPN was obtained in which case OPN at cycle 2 was used. Patient 12 is a male patient who died following 2 neoadjuvant cycles. The dotted lines indicate upper limit of OPN levels in a cohort of 90 healthy women (108.6 ng/mL) [26] and median value at baseline/cycle 1 (63.6 ng/mL), respectively.
