Figure 2.

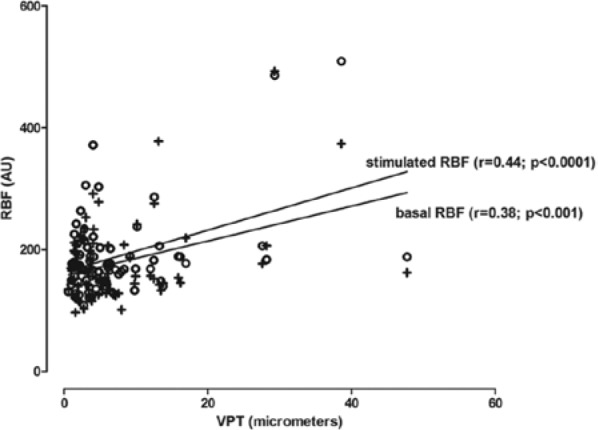
Linear regression between vibration perception threshold and basal or flicker stimulated retinal blood flow. AU, arbitrary units; VPT, vibration perception threshold; ○, baseline retinal blood flow; +, stimulated retinal blood flow.

Linear regression between vibration perception threshold and basal or flicker stimulated retinal blood flow. AU, arbitrary units; VPT, vibration perception threshold; ○, baseline retinal blood flow; +, stimulated retinal blood flow.