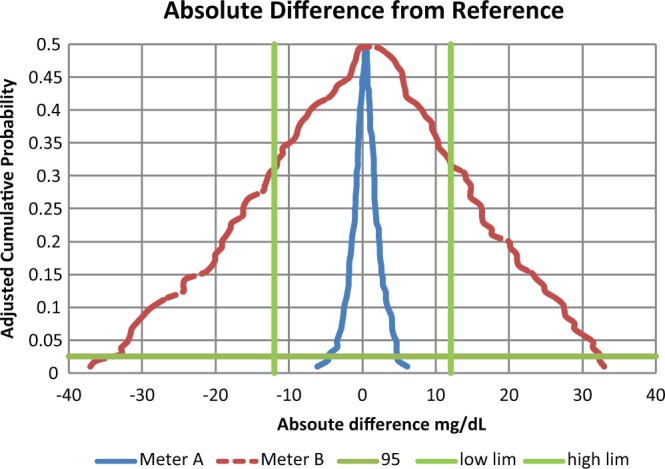
Figure 1.

Absolute differences for glucose meters for reference less than 100 mg/dL. The intersections of the horizontal and the straight vertical lines represent the limits to contain 95% of the data. A meter that is contained with this space meets goals. Thus meter A meets goals and meter B does not.
