Figure 2.

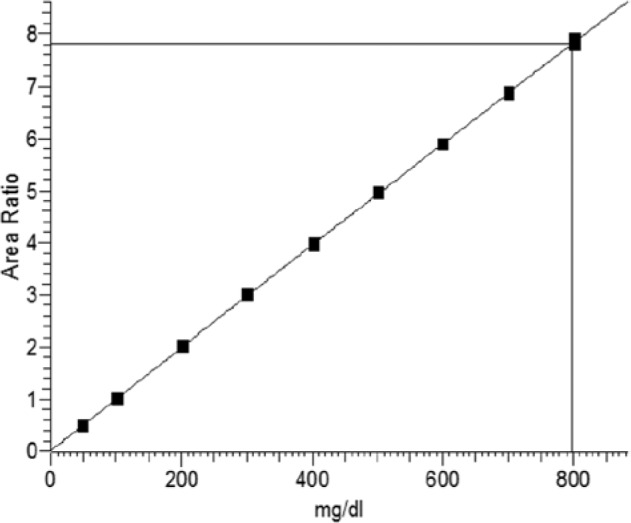
Calibration curve of the ID/GC/MS method for glucose: ratio of glucose to internal standard (area ratio) versus glucose concentration. The regression line has the formula: y = 0.0144625 + 0.0094011*X − 2.18869e−007*X2; r2 = 1.000.

Calibration curve of the ID/GC/MS method for glucose: ratio of glucose to internal standard (area ratio) versus glucose concentration. The regression line has the formula: y = 0.0144625 + 0.0094011*X − 2.18869e−007*X2; r2 = 1.000.