
Figure 2.
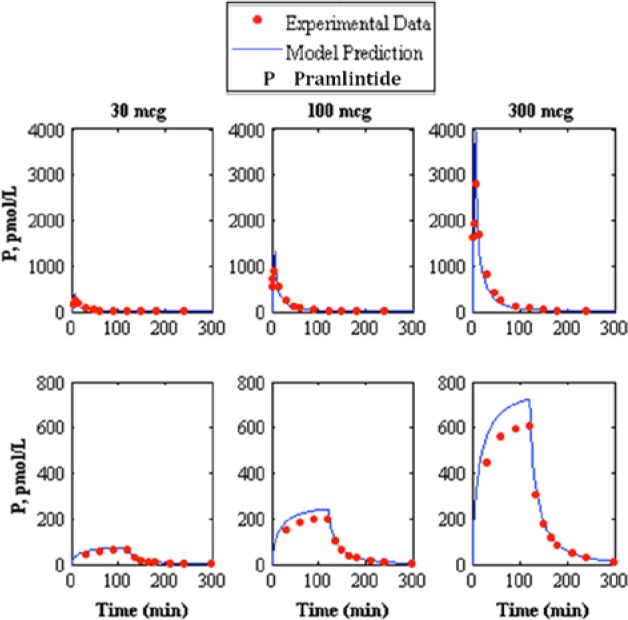
Comparison of intravenous pramlintide kinetics20 3-compartment model to experimental data.13 The top represents intravenous bolus and the bottom represents intravenous infusion, where the left, middle, and right represent pramlintide dosages of 30, 100, and 300 mcg, respectively, where the model prediction is represented by the solid line and experimental data points are represented by the dotted line.