
Figure 7.
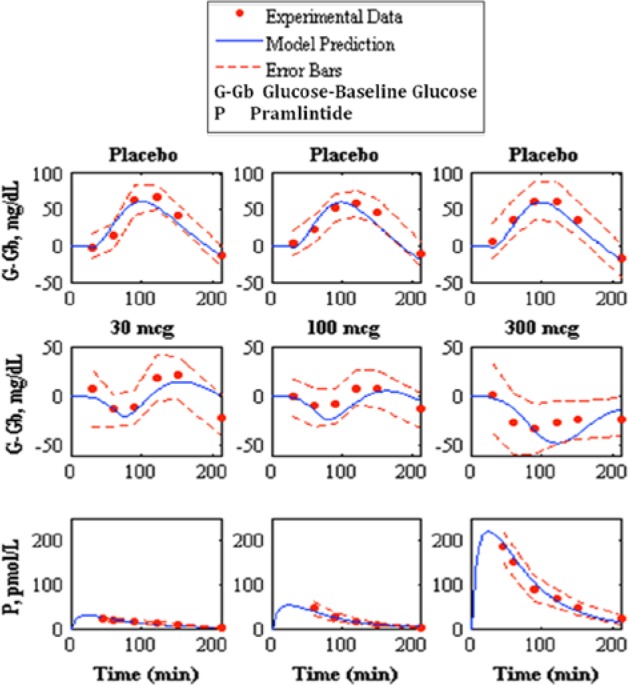
Prediction of pramlintide pharmacodynamics and subcutaneous pharmacokinetics to experimental data.22 The top shows the placebo fits, the middle shows pharmacodynamics predictions, and the bottom shows pharmacokinetics predictions of 30, 100, and 300 mcg pramlintide doses, left, middle, and right, respectively. Model prediction is represented by the solid line, experimental data points are represented by the dotted line, and the standard deviation of the experimental data is represented by the dashed line.