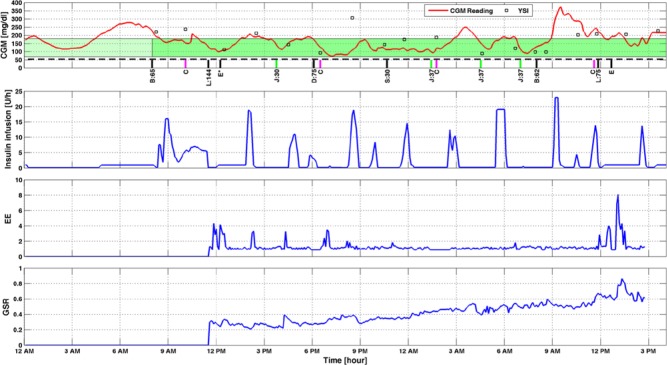
Figure 3.
Glucose concentration from continuous glucose monitor (CGM), infused insulin rate (Ins), energy expenditure (EE), and galvanic skin response (GSR) of Experiment 1. The green band indicates the target range of blood glucose concentration. The darker green section indicates the closed-loop duration. The black dashed line shows hypoglycemia threshold. Vertical bars: black, regular meal, snack, or exercise; green, hypoglycemia early alarm–based meal, snack, or juice; magenta, calibration. B, breakfast; L, lunch; D, dinner; S, snack; E, exercise; C, calibration; J, orange juice.

