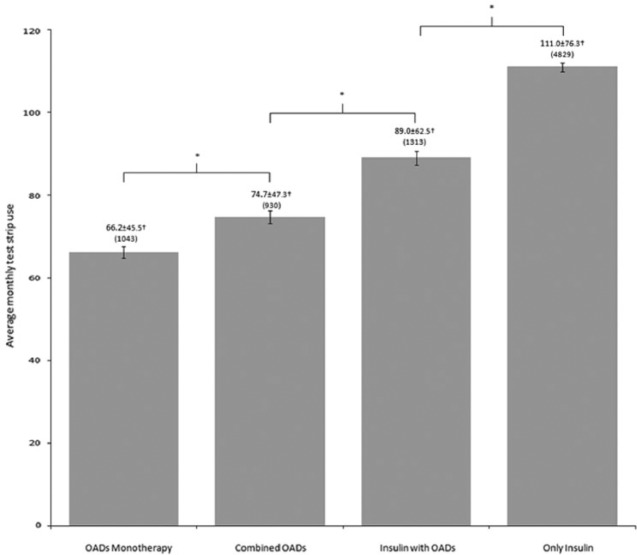
Figure 1.
COLFARMA test strip use according to type of treatment. Values represent the mean ± SD. Number of cases in brackets. Error bars represent standard error of the mean (SEM). † P < .001 (ANOVA; F statistic = 178.97) between all groups. *Statistically significant (P < .001) between the indicated groups.

