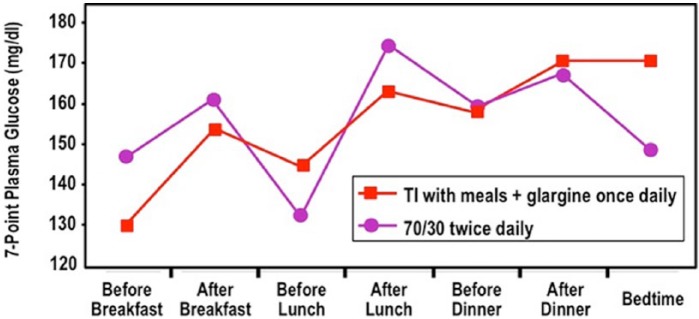
Figure 1.

Seven-point glucose profile at week 52 in T2DM subjects in a trial of Technosphere Insulin vs insulin comparator. Red square and red line = TI with each meal plus basal glargine insulin once daily. Purple circle and purple line = 70/30 insulin twice daily. This figure was adapted from data provided by Dr Anders Boss from a study by MannKind.7
