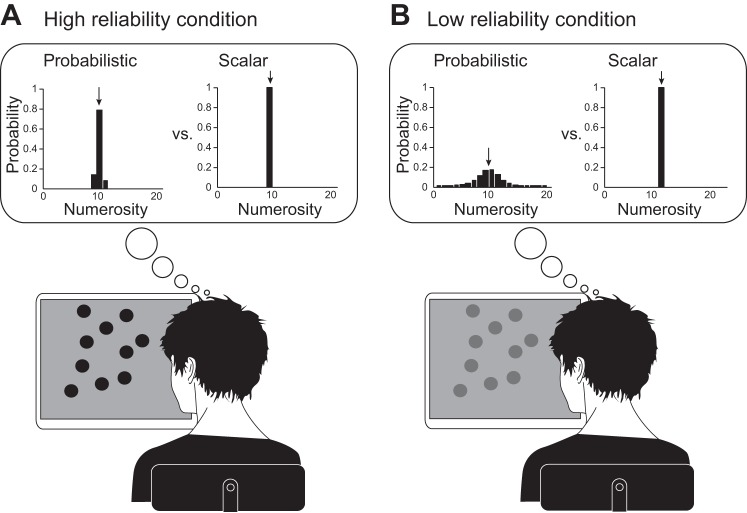
Fig. 1.
Probabilistic vs. scalar representation of numerosity. A: subject estimates numerosity from a reliable (bright) visual stimulus. Inset, left: stimuli lead to a distribution of possible numerosities, peaking near the correct value; right: stimuli lead to a scalar estimate of numerosity. B: subject estimates numerosity from an unreliable (low contrast) visual stimulus. Inset, left: stimuli lead to a distribution of possible numerosities that is much broader than in the corresponding example in A; right: stimuli lead to a scalar estimate of numerosity, similar to the corresponding example in A.

