
Fig. 4.
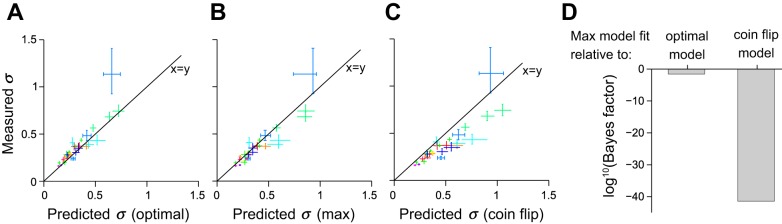
Evidence for a probabilistic decision strategy instructed by reliability. A: points relate measured sensitivity (estimated by σ; see Fig. 3A) on multisensory trials (ordinate) vs. optimal sensitivity predicted by the Bayesian model (abscissa). Each point represents a single subject on multisensory trials consisting of auditory and visual stimuli of varying reliability. Each subject contributed 3 points, 1 for each level of visual reliability. Points corresponding to the same subject are of the same color. Error bars indicate percentiles of the bootstrap distributions (1,000 samples). Points that lie on the x = y line indicate that the subject's measured performance on multisensory trials matched the optimal prediction exactly. Many subjects lie in close proximity to the x = y line. B and C: same as A except the horizontal axis shows predicted values for the max model (B) and coin flip model (C). D: Bayesian model comparison of optimal and coin flip model to max model. The max model wins, with the optimal model being a close second. The coin flip model is extremely unlikely to account for the data.